Extract Data from a Hand-Drawn Chart
This use case demonstrates how to extract data from a hand-drawn chart. You will upload a chart image into Revdoku, run an AI checklist to read every data point, then use a built-in script to deduplicate and list the extracted values.
Step 1: Open the Envelopes inbox.
Open the Envelopes inbox. The inbox lists the documents available for review.
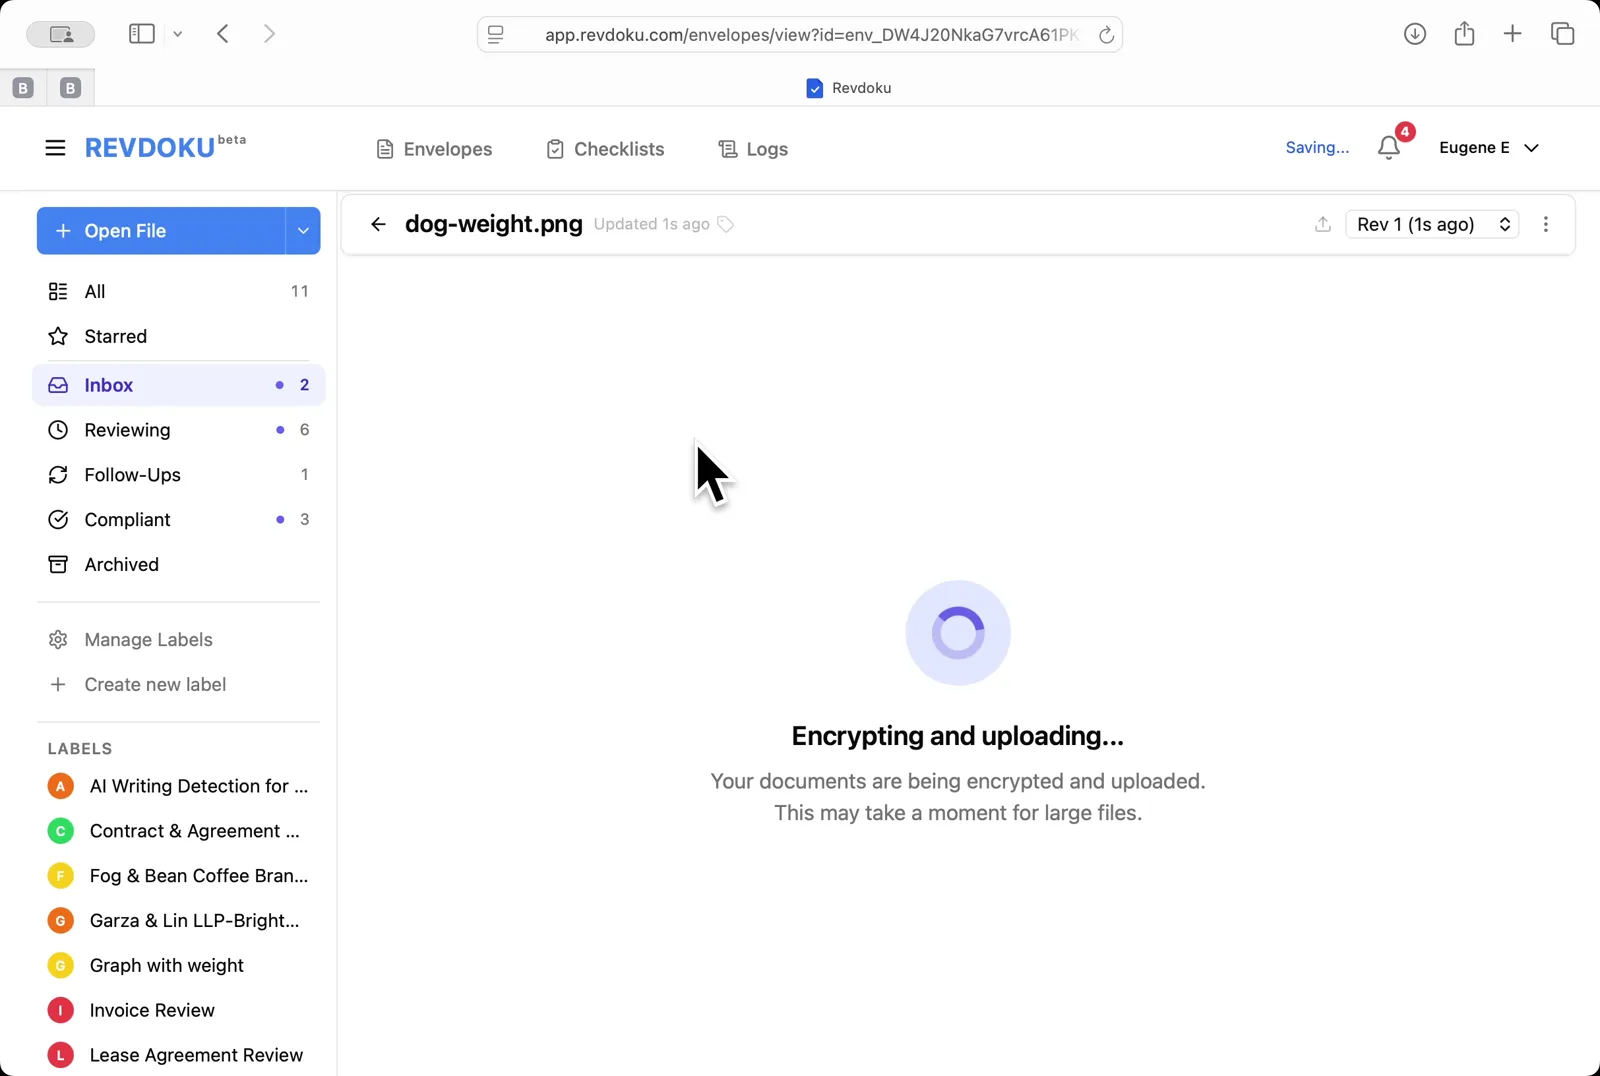
Step 2: Upload the chart.
Upload the chart. Click Open File and pick dog-weight.png; Revdoku encrypts and uploads the image.
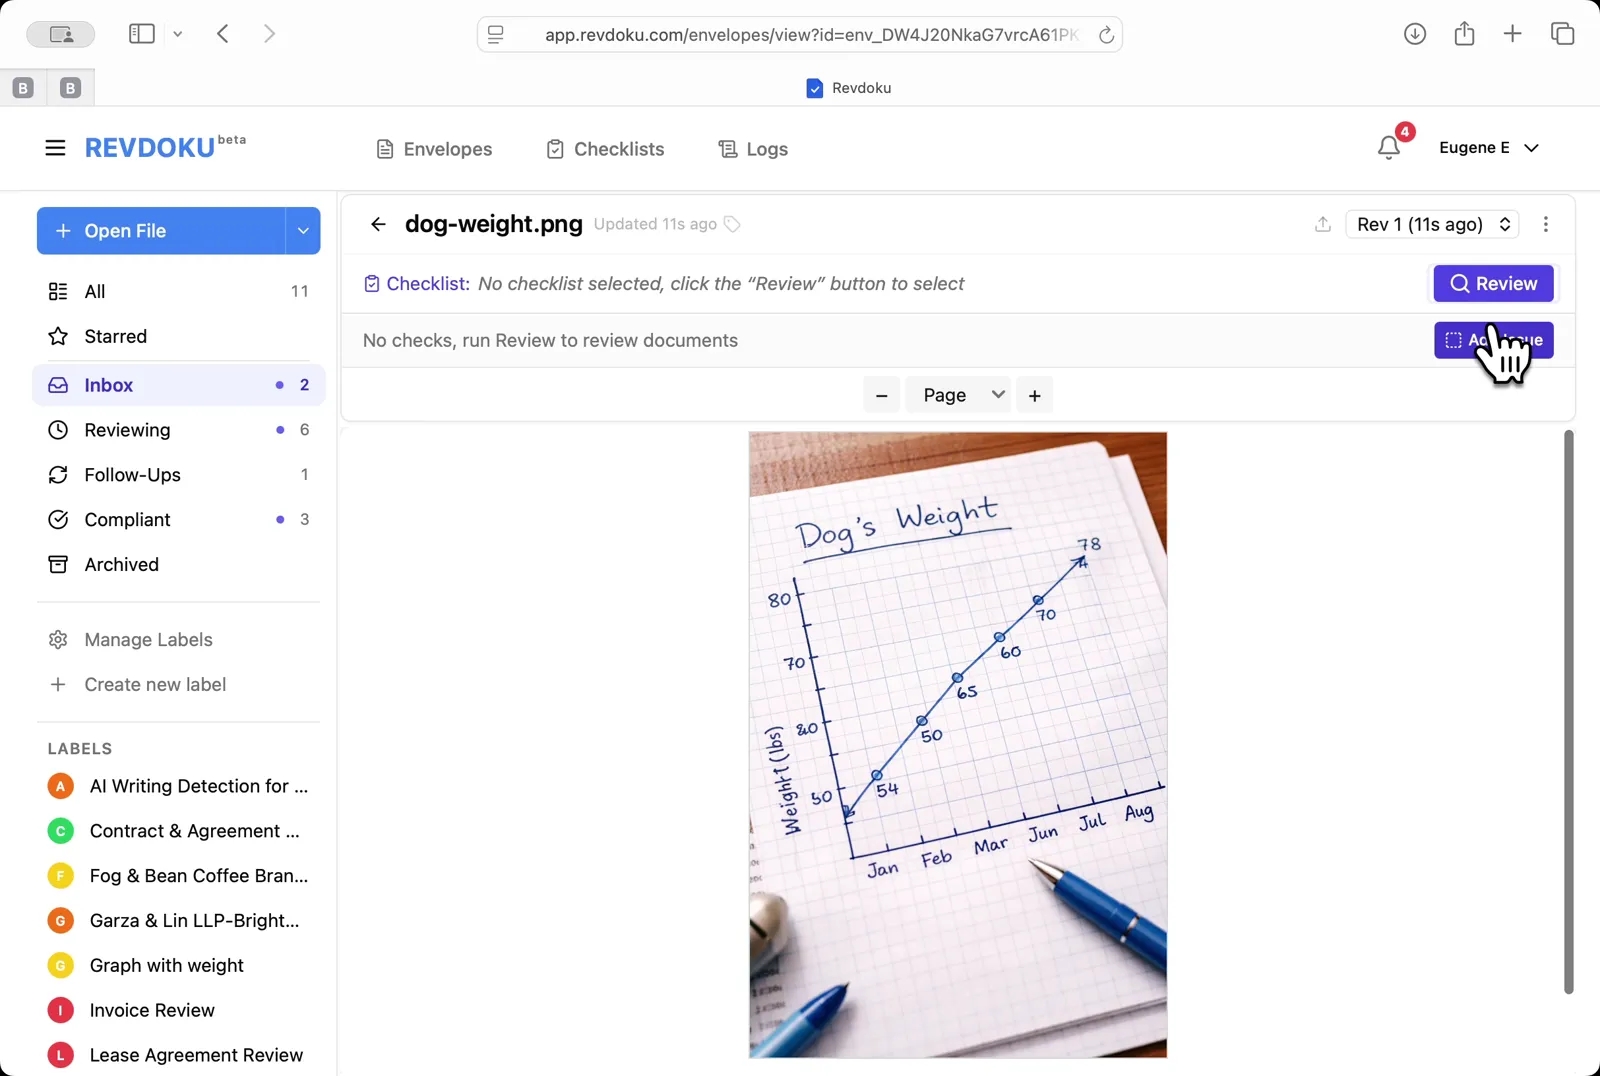
Step 3: Open the chart.
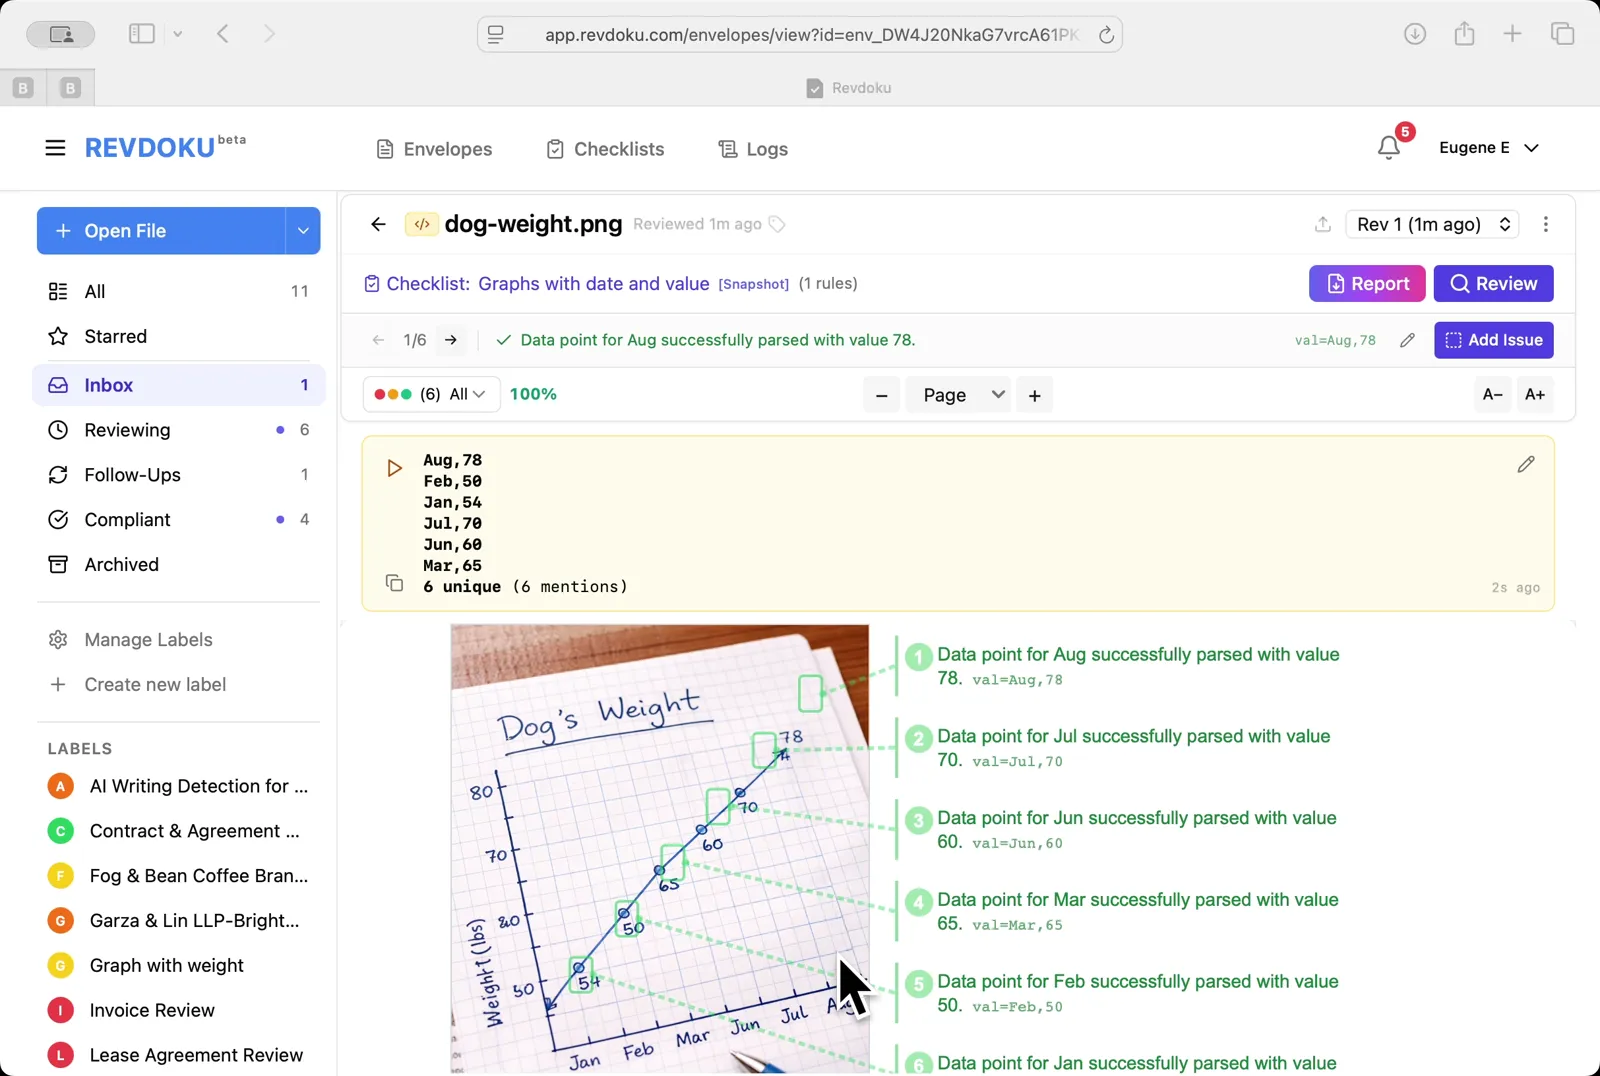
Open the chart. The viewer shows a hand-drawn Dog’s Weight line chart with monthly points from January to August.
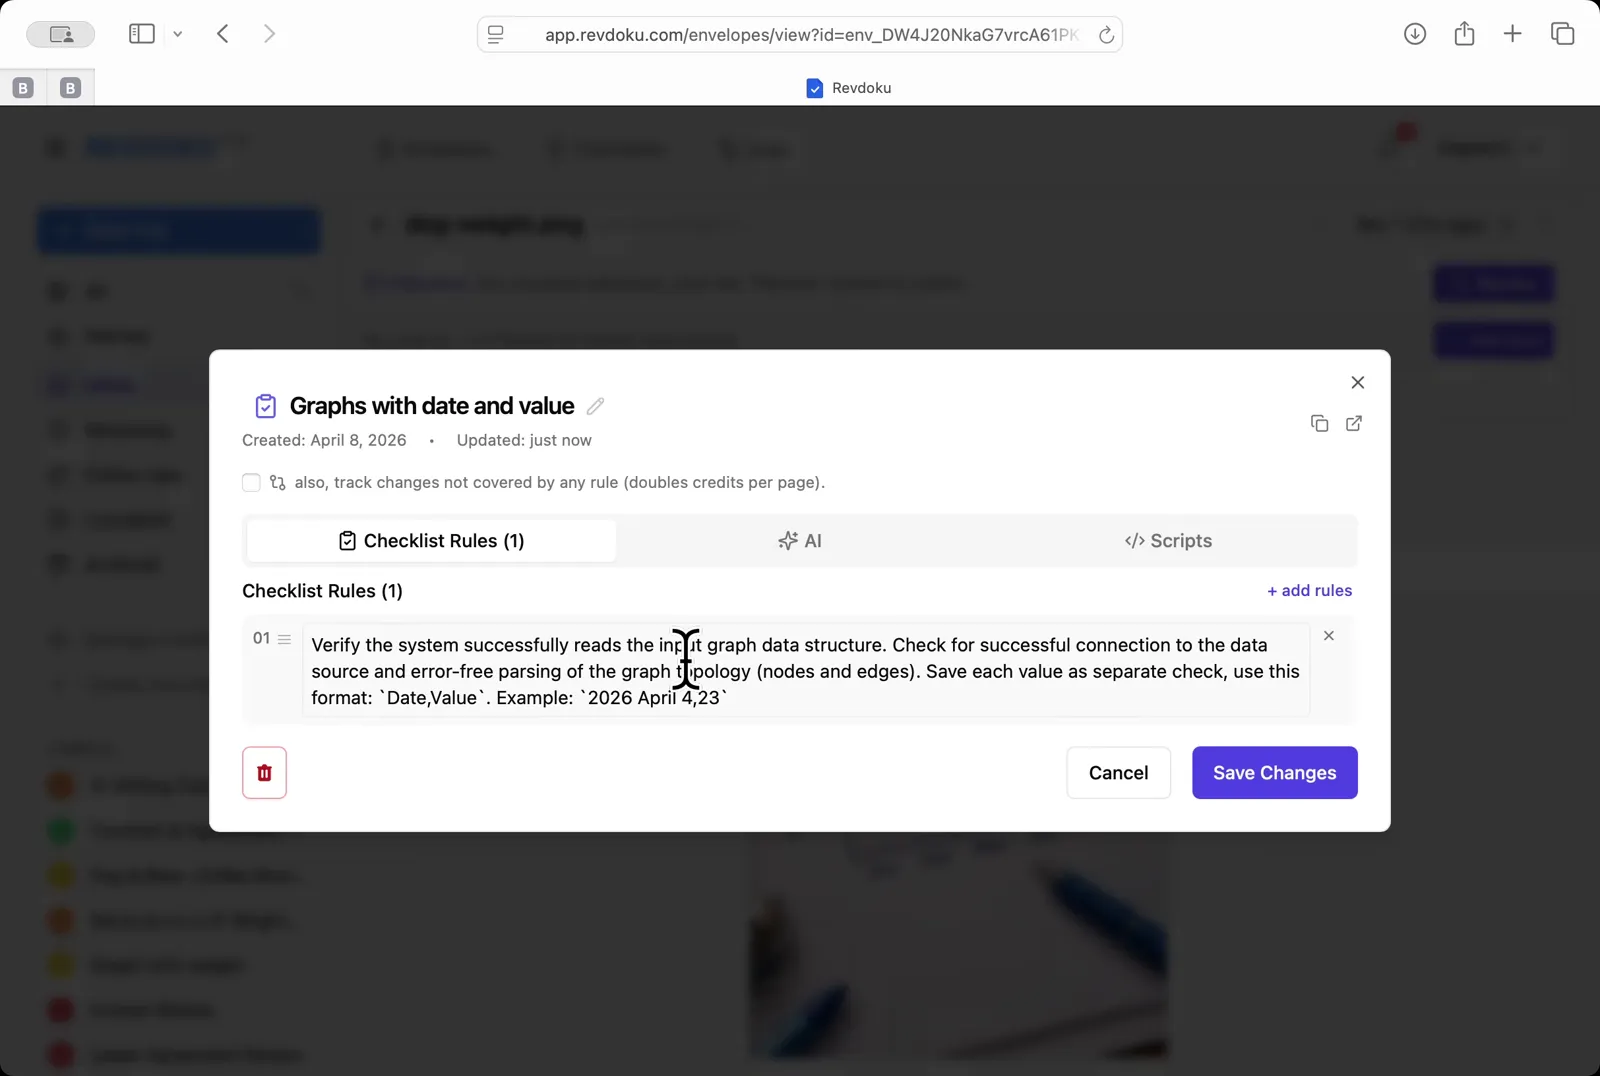
Step 4: Pick the chart-reading checklist.
Pick the chart-reading checklist. Choose Graphs with date and value — a one-rule checklist that asks the AI to extract every Date, Value pair.
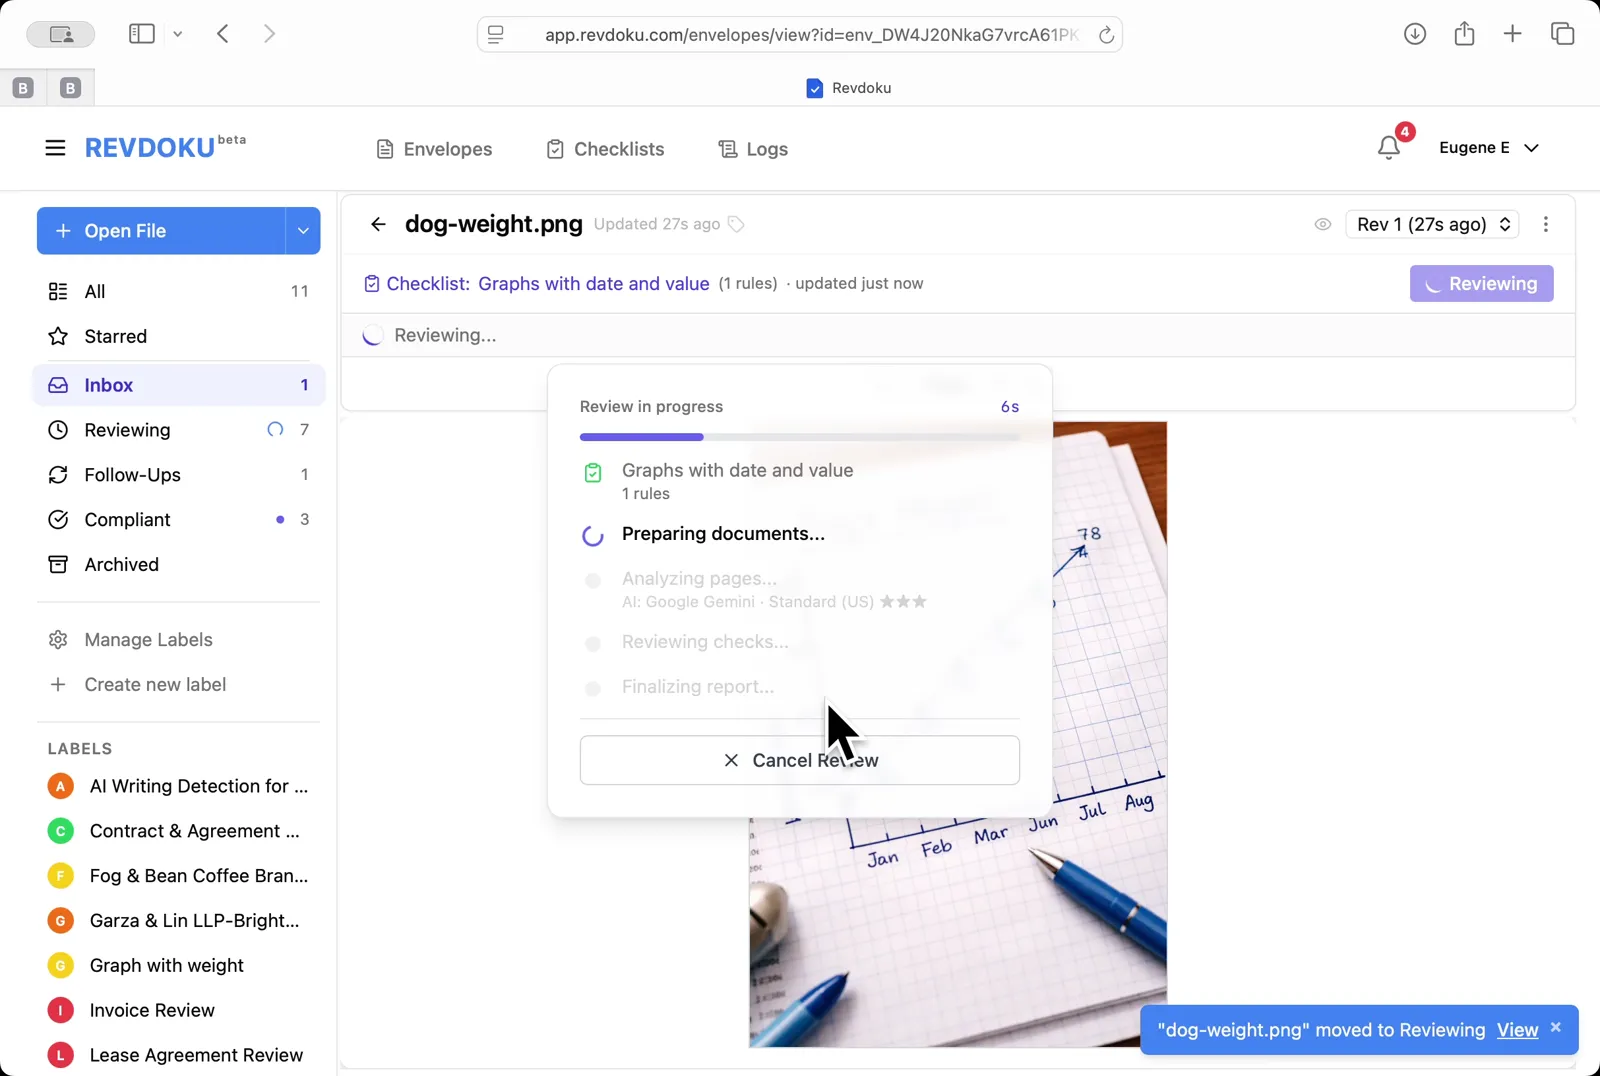
Step 5: Run the review.
Run the review. Click Review and Revdoku analyzes the page with Google Gemini and runs the rule.
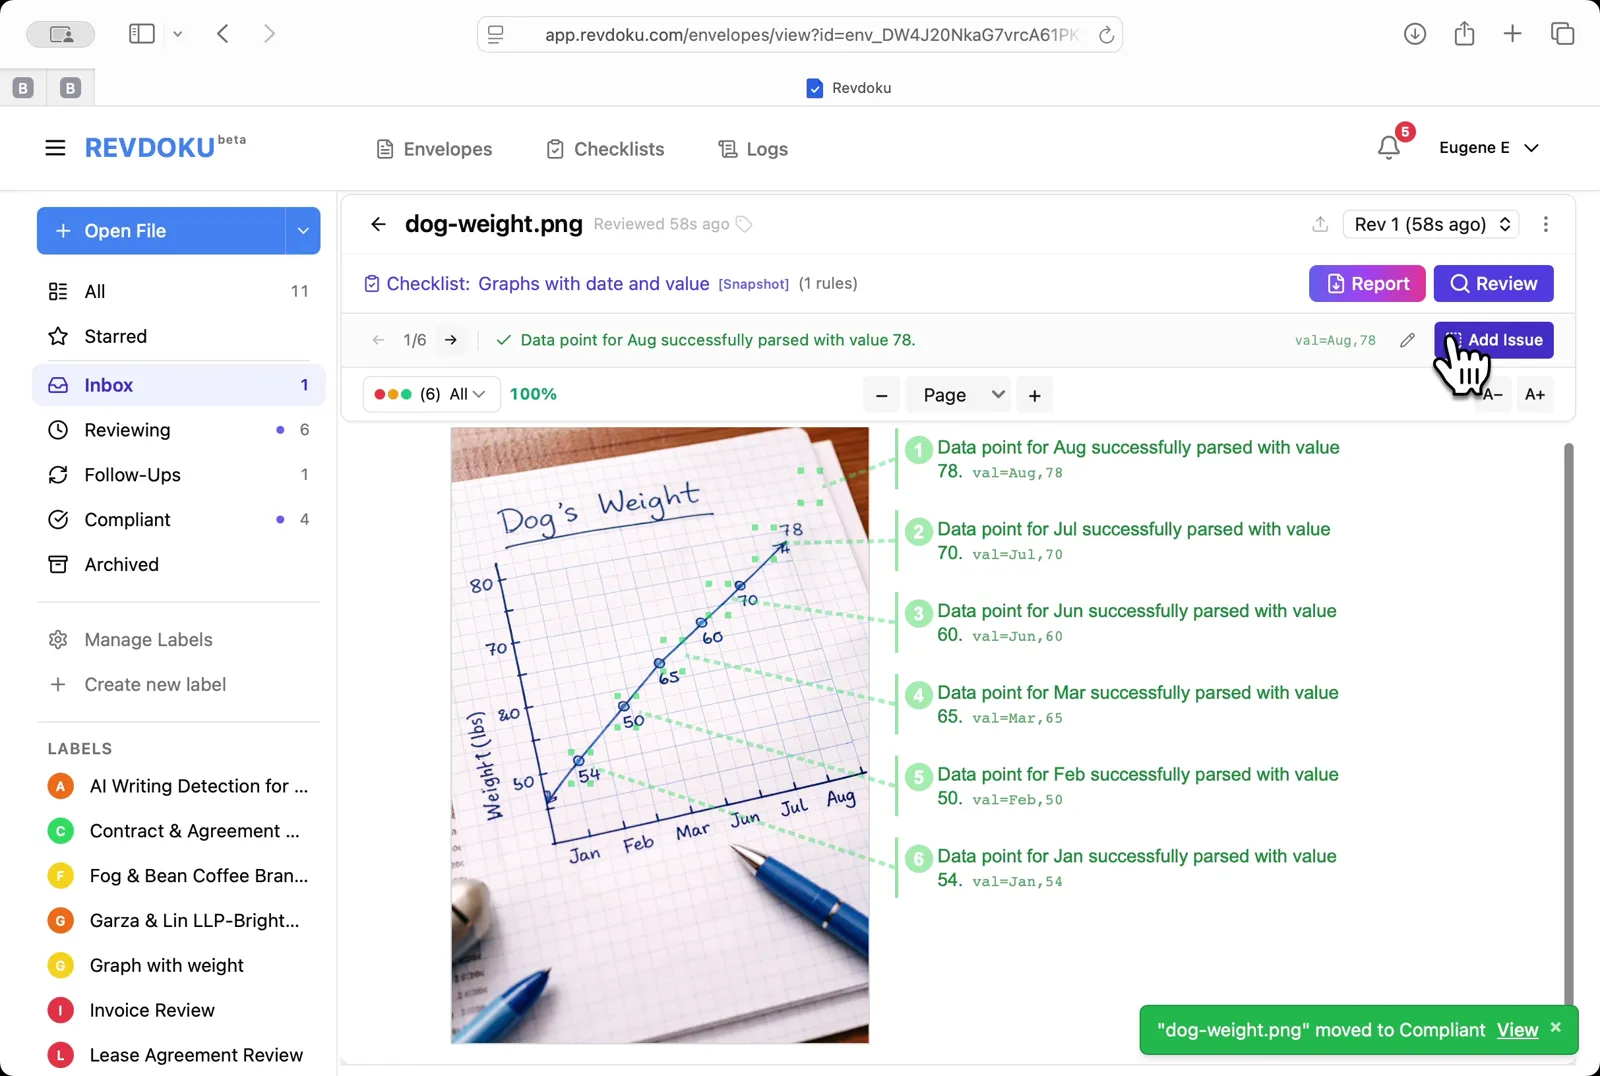
Step 6: Read the extracted points.
Read the extracted points. Every monthly point is annotated on the right with its parsed value, for example val:Aug,78.
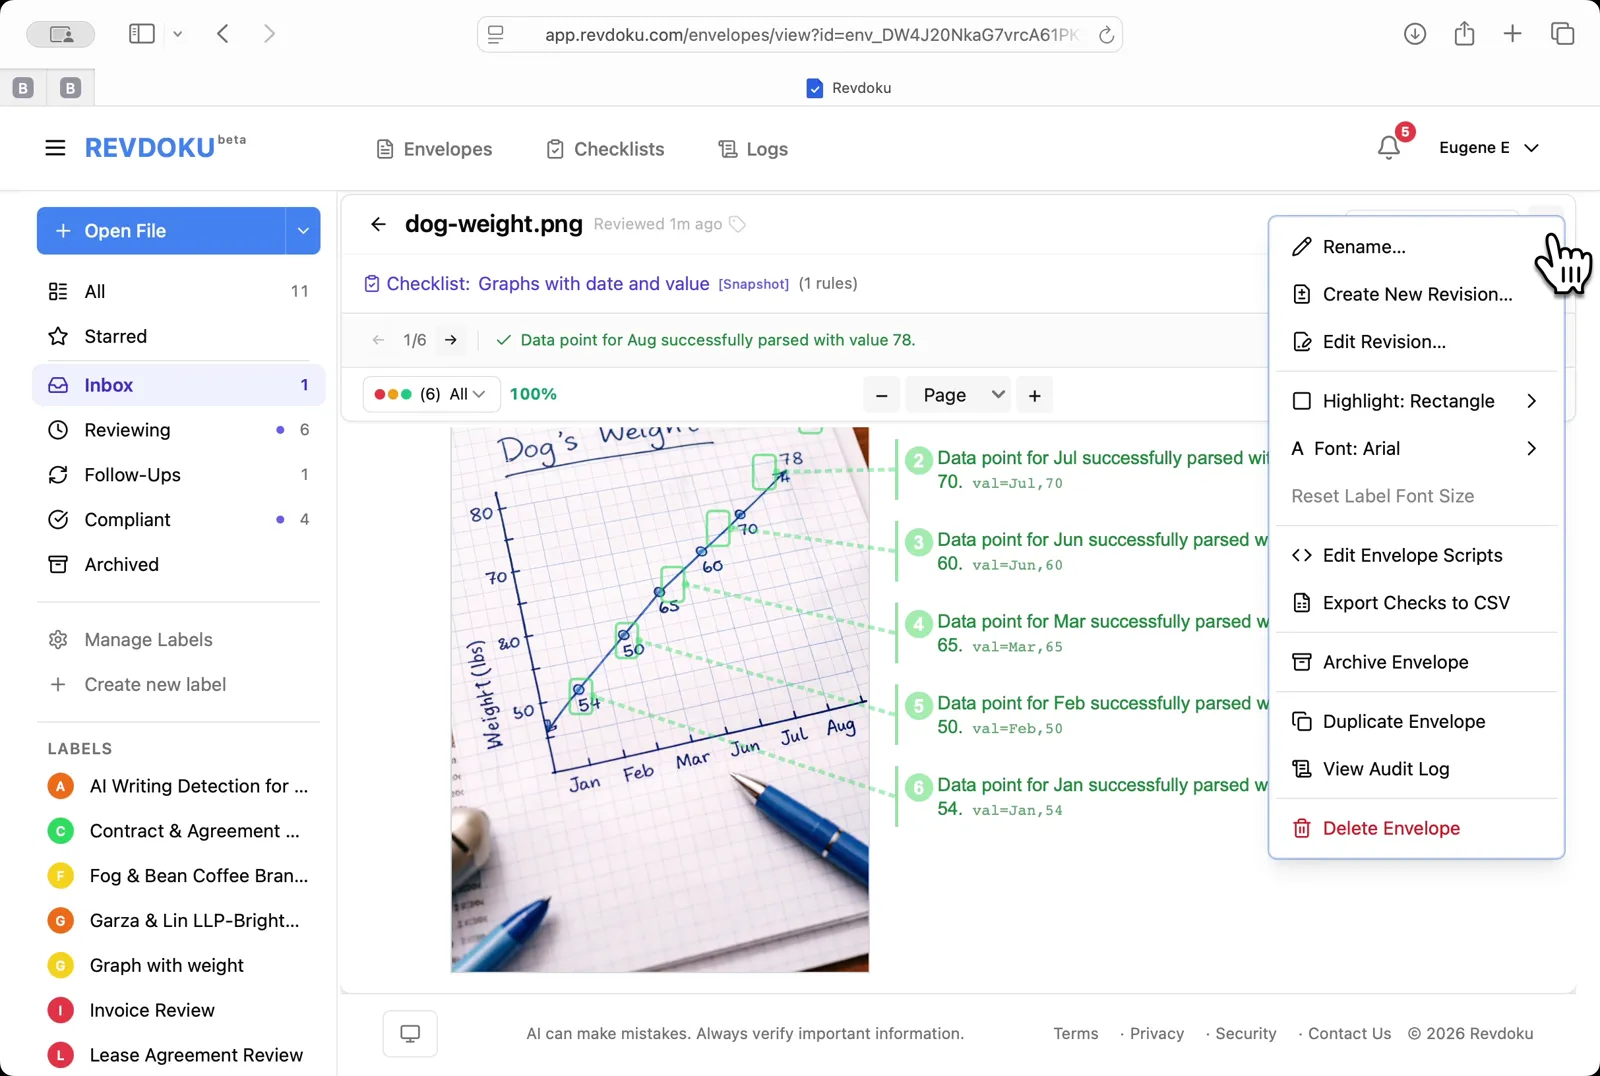
Step 7: Open the envelope menu.
Open the envelope menu. Pick Edit Envelope Scripts to add a script that rolls up the extracted values.
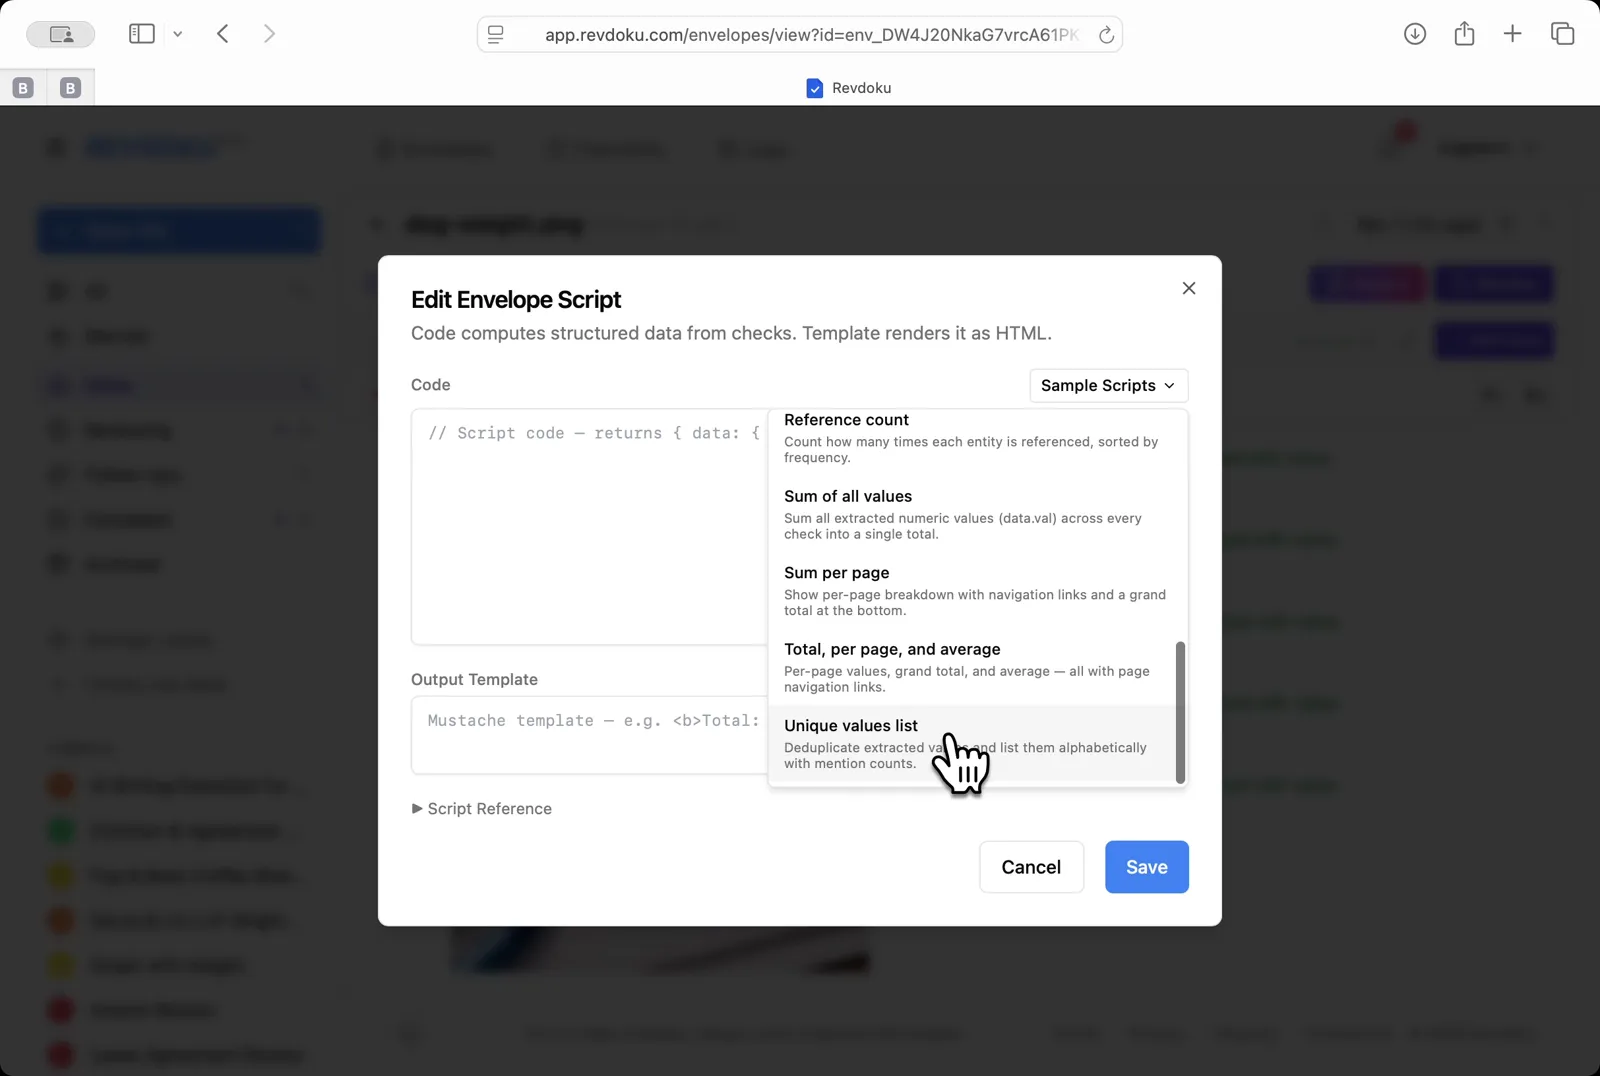
Step 8: Insert a sample script.
Insert a sample script. From the Sample Scripts dropdown, pick Unique values list to deduplicate and alphabetize the points.
Step 9: Read the rolled-up values.
Read the rolled-up values. A yellow summary card lists the 6 unique points (Aug,78 · Feb,58 · Jan,54 · Jul,70 · Jun,60 · Mar,65) above the original chart.
Conclusion
In this tutorial it was demonstrated how to use Revdoku for extracting data from a hand-drawn chart. The following steps were shown:
- Open the Envelopes inbox
- Upload the chart
- Open the chart
- Pick the chart-reading checklist
- Run the review
- Read the extracted points
- Open the envelope menu
- Insert a sample script
- Read the rolled-up values
What You Learned
This case showed how Revdoku can take a document, apply a structured checklist, and surface specific findings — all in under a minute. No manual line-by-line reading required.